Micron Technology
We view Micron as a structurally advantaged memory franchise mispriced as a cyclical commodity. AI-driven bit growth, HBM3E leadership, and onshored capacity support durable free cash flow under conservative assumptions.
We believe Micron Technology presents a rare opportunity to own the future of memory at a significant discount to intrinsic value. The market continues to price Micron as a cyclical commodity producer, but the world is changing fast. The AI boom and hyperscaler spending spree are transforming memory demand into a structural, not cyclical, story—and Micron sits at the center.
The market’s framework is anchored in past down-cycles when PC and smartphone sales dictated pricing. That playbook is now obsolete. Micron is running near full capacity with strong visibility into next year’s demand as AI-related workloads accelerate. With capital expenditures expected to exceed $200B over coming decades—supported by CHIPS Act incentives and a push to onshore manufacturing to the United States—Micron is building the supply base for a new era of sustained, data-driven growth.
Structural Moat
Memory manufacturing rewards scale and precision. Micron, Samsung, and SK hynix collectively supply the vast majority of global DRAM, creating an environment where technology cadence and capital discipline—not sheer volume—drive economics.
Technological Advantage
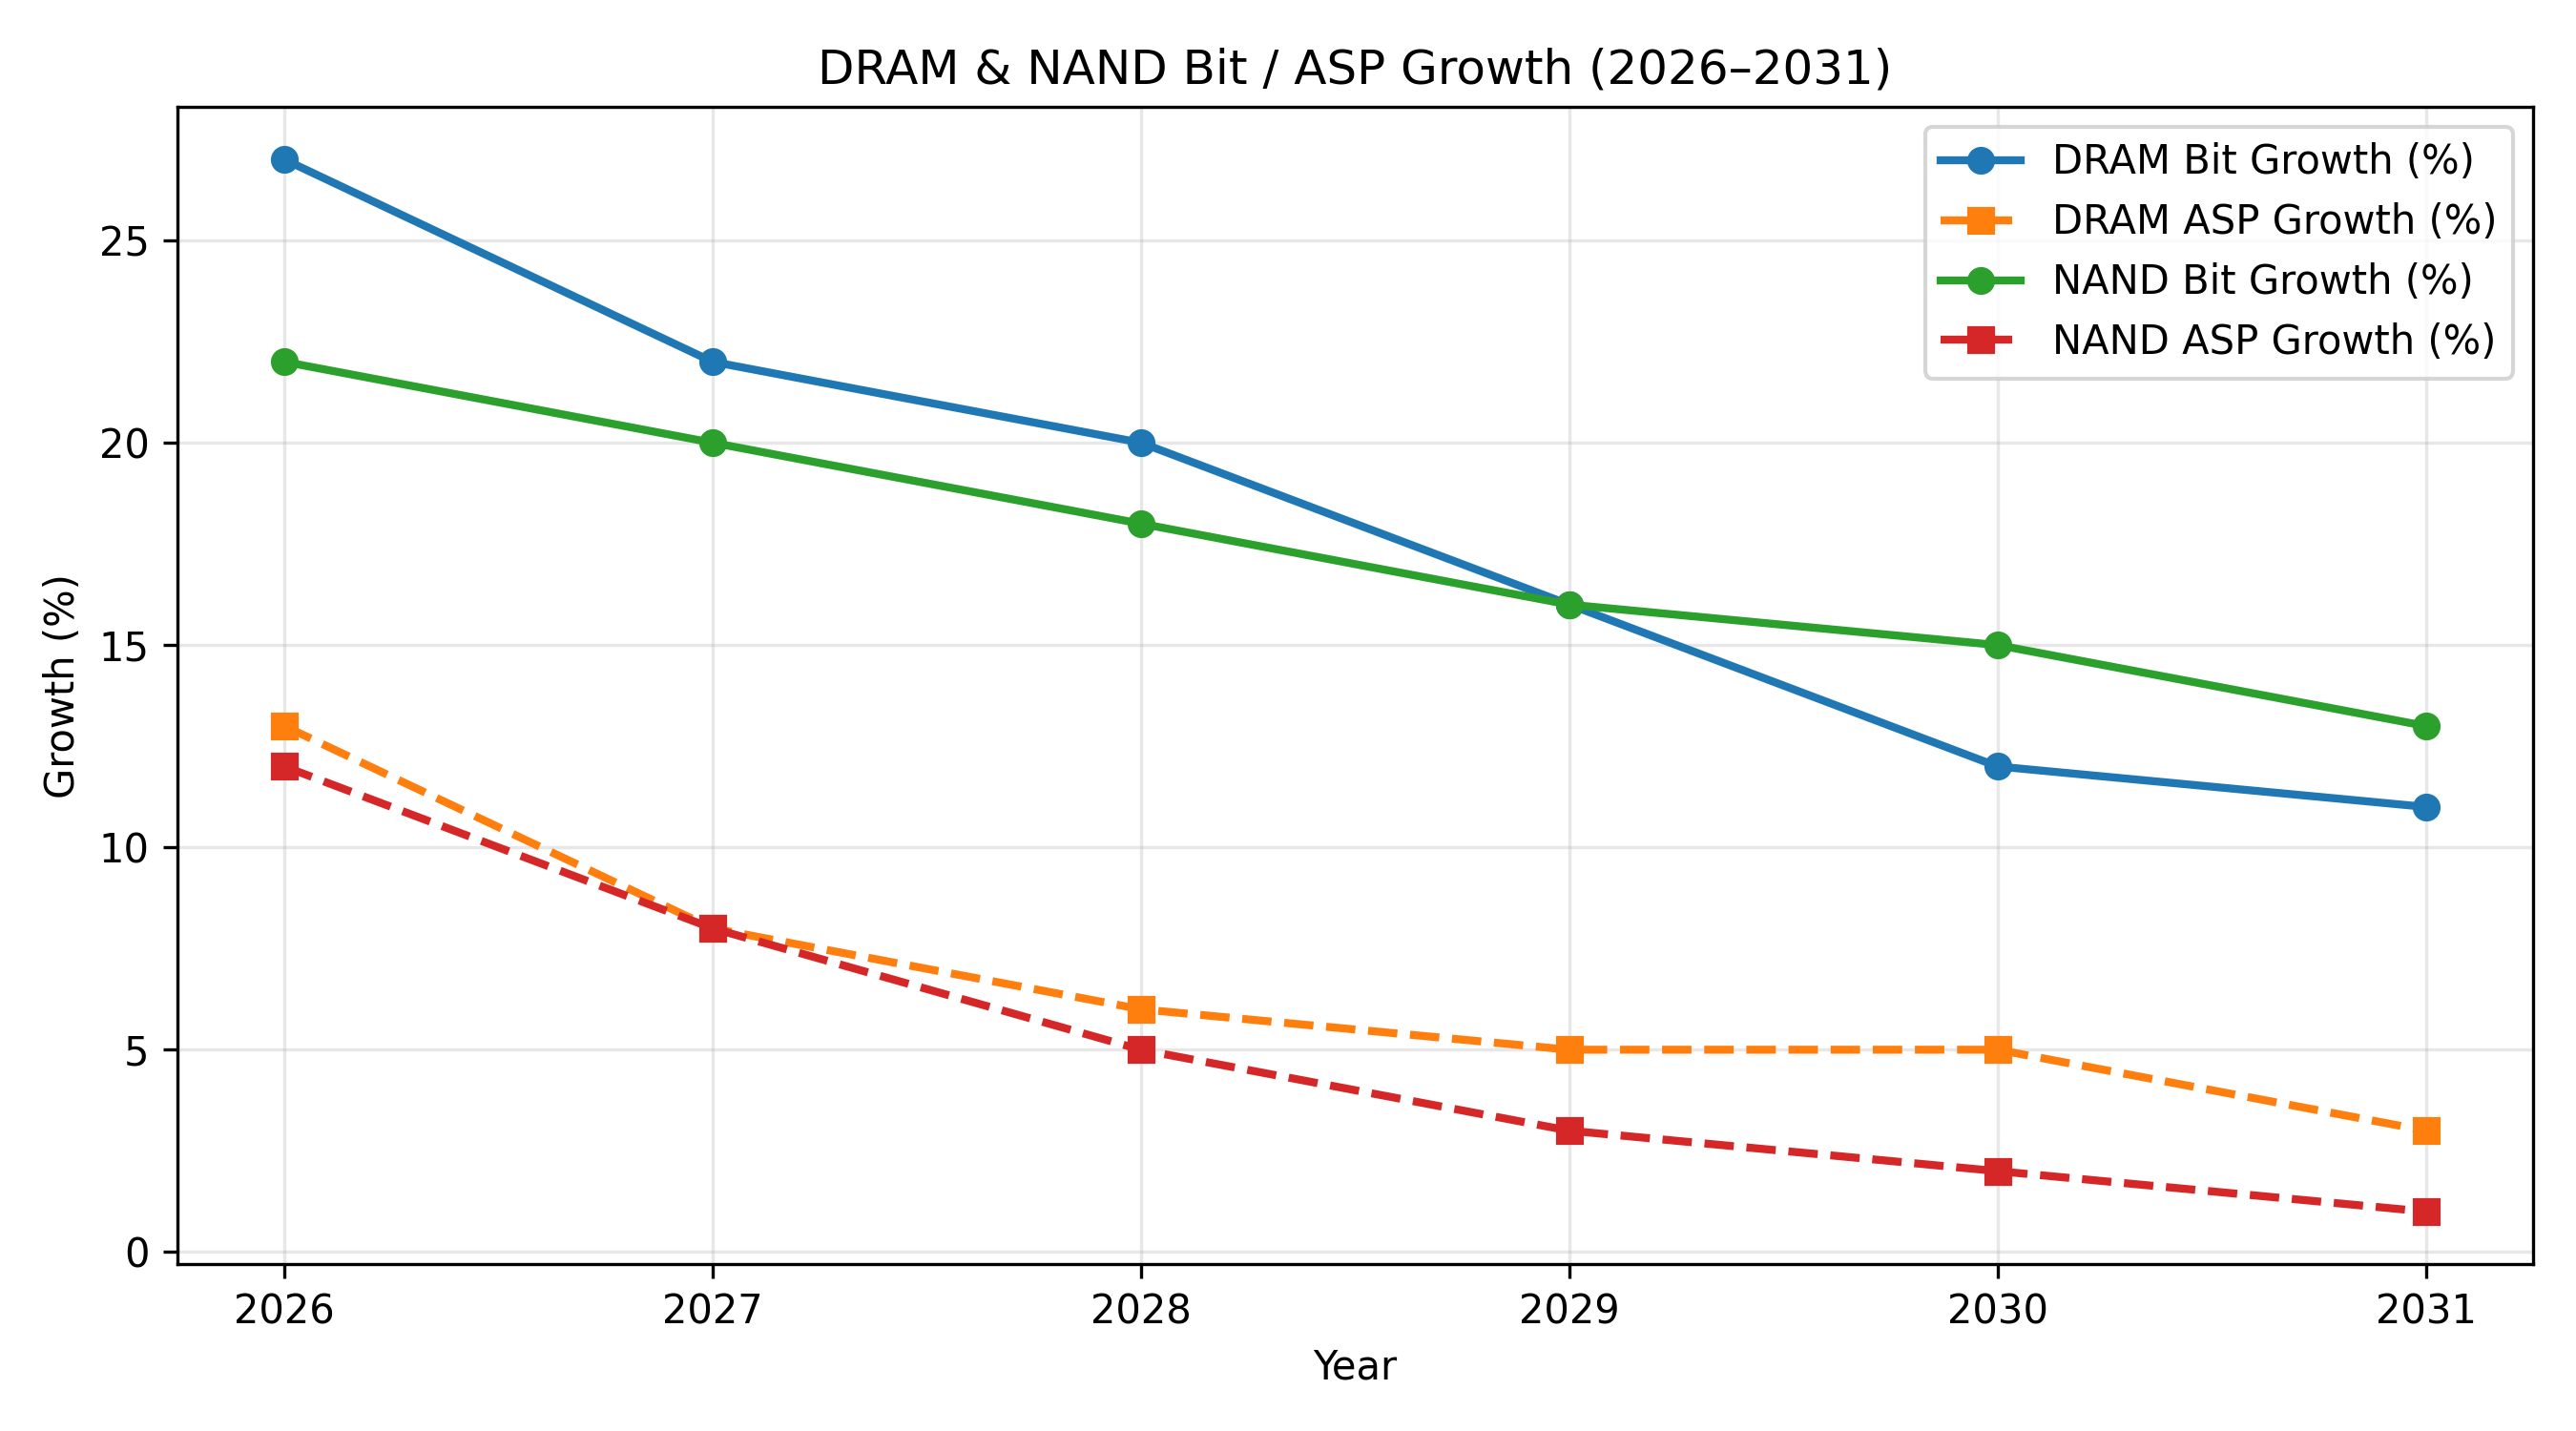
Micron’s moat is grounded in tangible process and packaging advantages. The latest 1β DRAM node delivers ~15–20% higher bit density with lower leakage via advanced multi-patterning and HKMG transistors, reducing cost per bit even as peers lean on more capital-intensive EUV. In parallel, HBM3E pushes bandwidth beyond 1.2 TB/s per stack at ~1.1 V, yielding ~30% lower power per bit through optimized TSV bonding and superior thermals. The result is lower manufacturing cost and premium pricing for AI data centers, where memory efficiency directly hits system-level power budgets. Few firms can replicate this integration of advanced lithography and 3D-stacked packaging, giving Micron a durable cost-and-performance edge.
Geopolitical Positioning
Founded in 1978 in Boise, Idaho, Micron remains the only U.S.-headquartered manufacturer of both DRAM and NAND at scale. That legacy is now a strategic asset. As governments secure domestic semiconductor supply chains, Micron’s U.S. footprint positions it as a prime beneficiary of the CHIPS and Science Act, with >$6B in grants and tax incentives allocated to Idaho and New York megafabs. Plans to invest up to $200B in American memory manufacturing re-shore capabilities that had shifted to Asia, creating a geopolitical moat: Micron is both a national-security priority and a commercial supplier to the largest hyperscalers.
Valuation
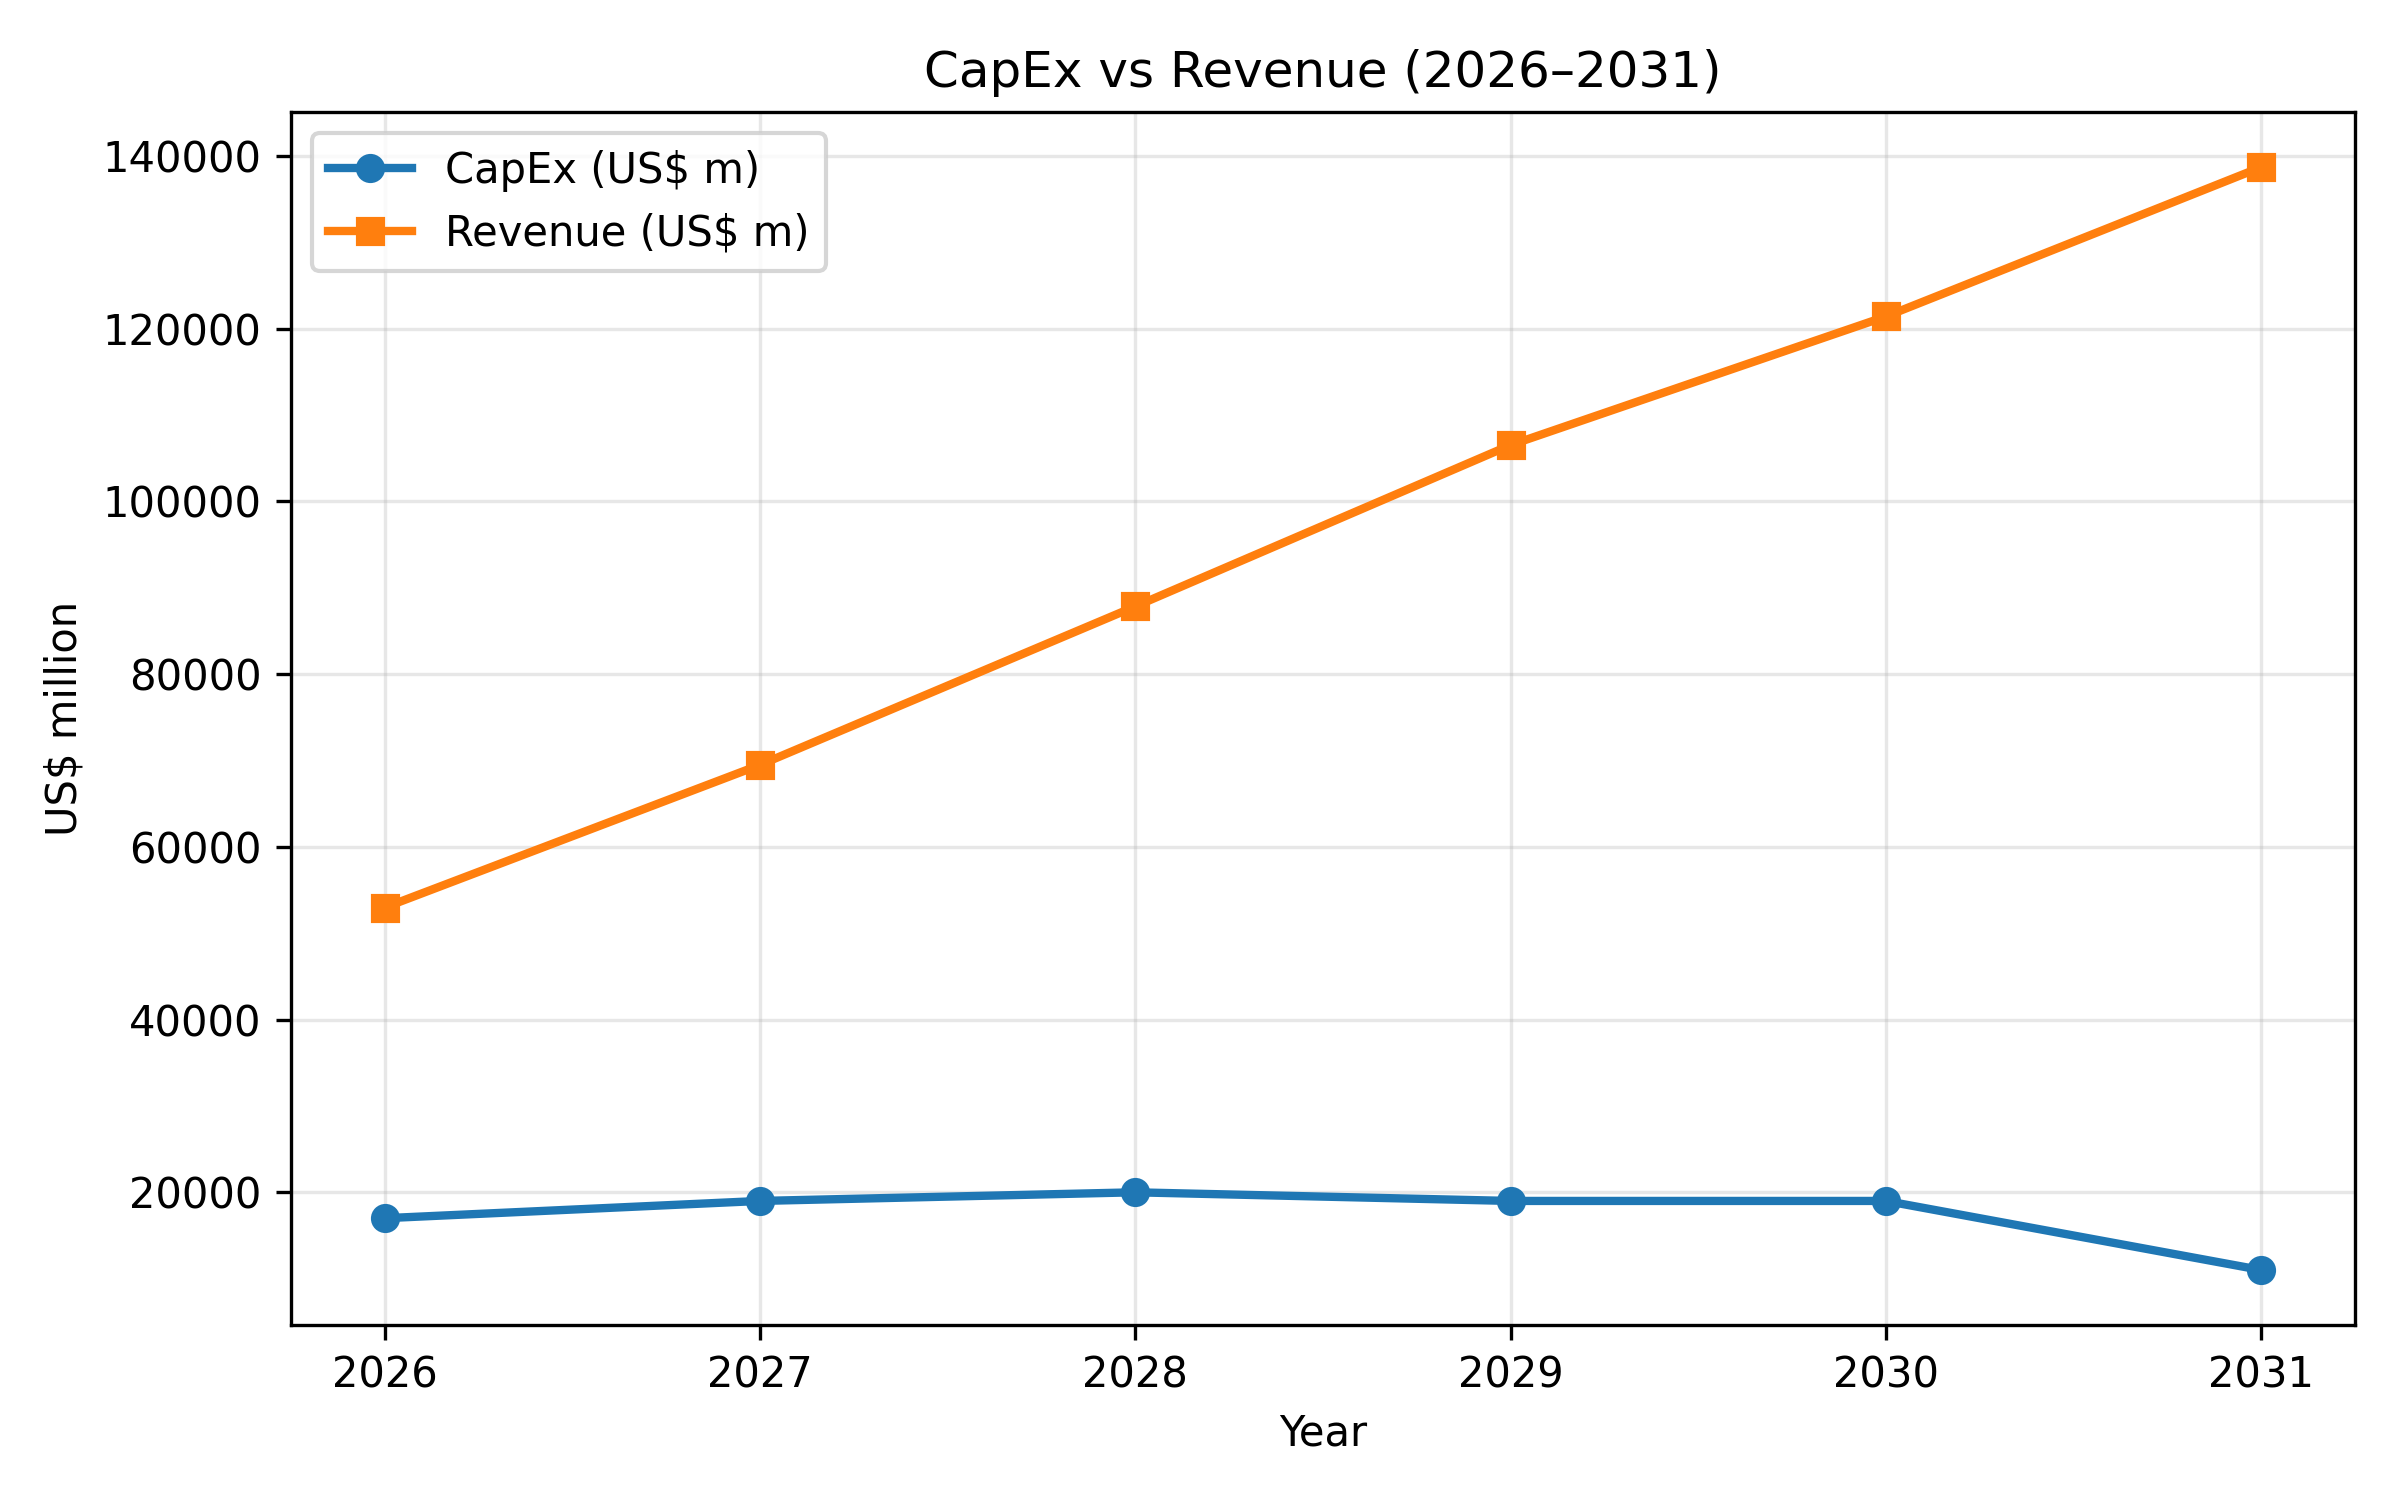
Our framework applies a 13.45% WACC and 2.9% terminal growth, consistent with long-run global output and Micron’s normalized capital efficiency. The discounted cash-flow model indicates an equity value of ~$306B, or $272 per share. We assume moderate revenue growth, conservative FCF conversion after the current investment cycle, and capital intensity normalizing below 21% of revenue. The goal is not to forecast short-term market moves, but to establish a disciplined view of long-term earning power.
Capital Structure. The model incorporates a measured increase in leverage to fund U.S. manufacturing commitments. This reflects the capital-intensive nature of expansion rather than a change in financial discipline. Even with higher debt, the balance sheet remains conservatively capitalized, supported by cash generation and policy incentives that reduce effective funding costs. As capital intensity normalizes, Micron should deleverage organically while preserving flexibility to invest in next-gen process technologies.
Risks & Long-Term View
Key risks include: (i) geopolitics (export controls, regional tensions); (ii) execution on U.S. fab buildout (timelines, cost overruns); (iii) pricing discipline if peers accelerate capacity; (iv) technology cadence (sustaining HBM/node leadership); and (v) demand normalization post initial AI buildout.
Despite these factors, Micron enters this phase from a position of strength: leading-edge capability, policy tailwinds, and multi-year customer commitments. We view Micron not as a short-term cyclical trade, but as a long-duration compounding asset at the core of the world’s demand for intelligence and data infrastructure.
Disclaimer
At the time this model was updated, some figures shown in the graph may be outdated. Any inaccurate or obsolete data should be disregarded.
Operating & Financial Exhibits